> ## Documentation Index
> Fetch the complete documentation index at: https://wisdomai-add-trigger-agent-api.mintlify.site/llms.txt
> Use this file to discover all available pages before exploring further.
# How to Create Metrics
Metrics are numeric, quantitative values that can be measured to assess and track business performance. They help you identify trends to make informed decisions. This guide will walk you through how to create and use metrics effectively in WisdomAI.
## Types of Metrics
You can have different kinds of Metrics. Here's a breakdown of the most common types:
* **Simple Metrics:** These are direct calculations from existing data. Think of something straightforward like the sum of your total revenue.
* **Calculated Metrics:** These metrics combine other metrics using formulas. For example, Profit could be a calculated metric derived from subtracting "Cost" from "Revenue."
* **Ratios:** Ratios involve dividing one metric by another. A classic example is Conversion Rate, calculated by dividing "Orders" by "Visits."
* **Time-based Metrics:** These metrics incorporate time into their calculation, allowing you to analyze trends over periods. Examples include year-over-year growth or rolling averages.
## Create a Metric
The process of creating a metric in WisdomAI is managed within each specific Domain.
Here's a step-by-step guide:
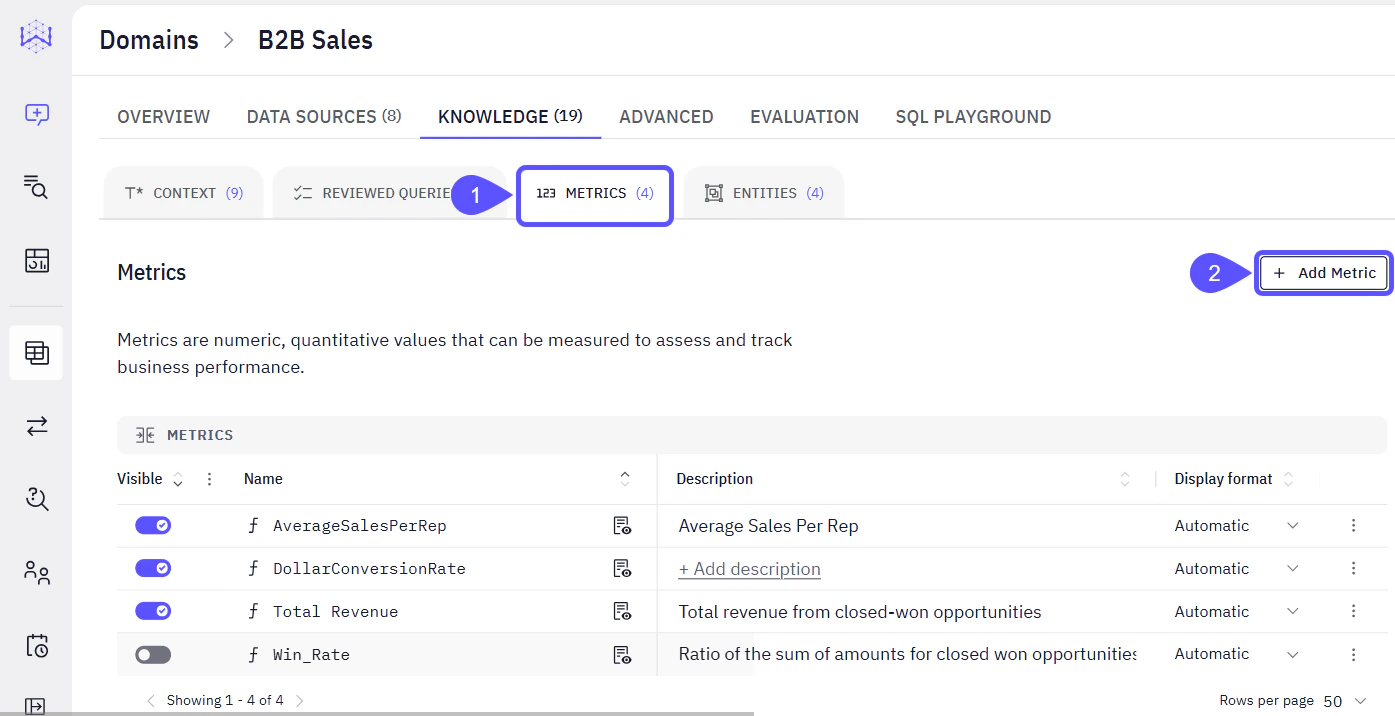
1. Navigate to the **Metrics** Tab within a **Domain**.
* Select the relevant **Domain** (e.g., "B2B Sales") > go to the **Knowledge** tab > click **Metrics**.
2. Click the **Add Metric** button.
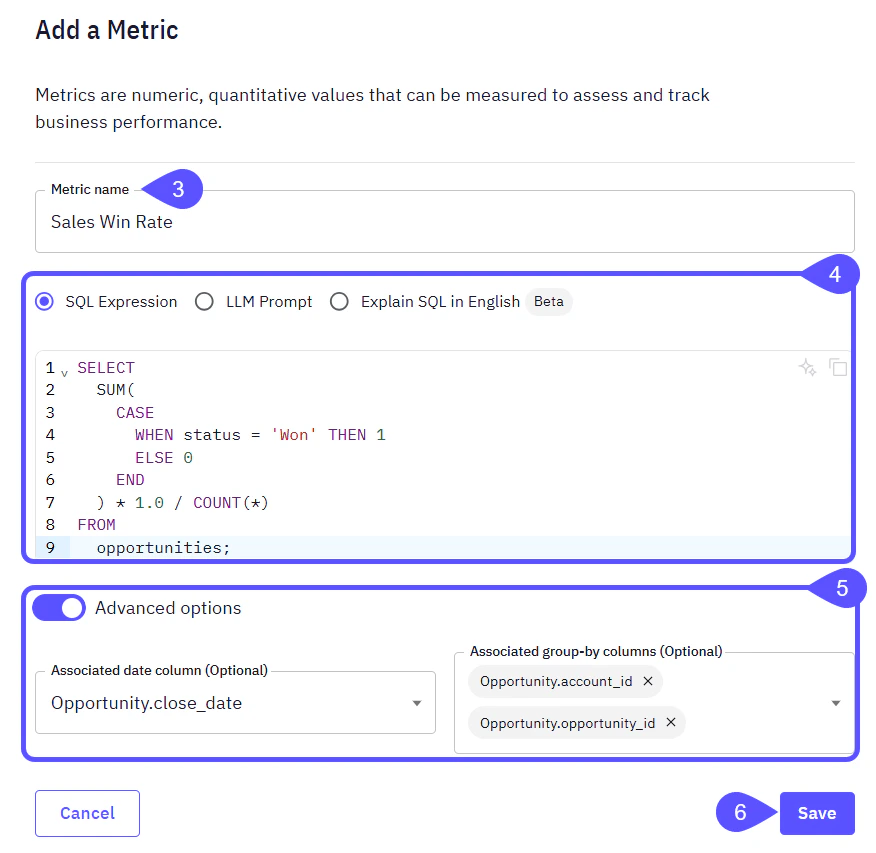
 3. In the Add a Metric modal window that opens, provide your metric a clear, concise **name** that accurately describes what it measures.
4. Select a **Calculation Method** and then input your SQL expression, LLM prompt, or English explanation in the corresponding area.
| **Calculation Method** | **Definition** |
| ------------------------------- | -------------------------------------------------------------------------------------------------------------------------------------------------------------------------------- |
| SQL Expression | This is where you write standard SQL queries to define your metric's calculation. This is typically used for precise and complex aggregations. |
| LLM Prompt | Use a Large Language Model (LLM) to define the metric by selecting the Input column and providing a natural language prompt. |
| Explain SQL in English *(Beta)* | Describe your desired SQL calculation in plain English and click on Test (a previous step before saving your result). The system will attempt to generate the corresponding SQL. |
5. *(If SQL was chosen)* Toggle the **Advanced Options** switch to access additional configurations:
* **Associated date column:** (Optional) This allows you to specify a date column in your data that is relevant to this metric. This is particularly useful for time-based analyses, filtering by date, or for metrics that inherently track changes over time.
* **Associated group-by columns:** (Optional) Here, you can pre-define columns that are commonly used for grouping or segmenting this metric. (e.g. account State, customer ID)
6. Once you have configured your metric, click **Save** to add it to your Domain's metrics list.
3. In the Add a Metric modal window that opens, provide your metric a clear, concise **name** that accurately describes what it measures.
4. Select a **Calculation Method** and then input your SQL expression, LLM prompt, or English explanation in the corresponding area.
| **Calculation Method** | **Definition** |
| ------------------------------- | -------------------------------------------------------------------------------------------------------------------------------------------------------------------------------- |
| SQL Expression | This is where you write standard SQL queries to define your metric's calculation. This is typically used for precise and complex aggregations. |
| LLM Prompt | Use a Large Language Model (LLM) to define the metric by selecting the Input column and providing a natural language prompt. |
| Explain SQL in English *(Beta)* | Describe your desired SQL calculation in plain English and click on Test (a previous step before saving your result). The system will attempt to generate the corresponding SQL. |
5. *(If SQL was chosen)* Toggle the **Advanced Options** switch to access additional configurations:
* **Associated date column:** (Optional) This allows you to specify a date column in your data that is relevant to this metric. This is particularly useful for time-based analyses, filtering by date, or for metrics that inherently track changes over time.
* **Associated group-by columns:** (Optional) Here, you can pre-define columns that are commonly used for grouping or segmenting this metric. (e.g. account State, customer ID)
6. Once you have configured your metric, click **Save** to add it to your Domain's metrics list.
 ## Sales Metrics Examples
When you create metrics, you define the SQL expression that dictates how the metric is calculated from your raw data. This allows for precise data analysis. Once defined, they will appear in your Metrics list with their descriptions and display formats.
Here are some practical examples of sales metrics and how they might be configured.
| Metric Name | Description | SQL Expression | Display Format |
| :----------------------- | :--------------------------------------------------------------------------------------------------------------------------- | :---------------------------------------------------------- | :------------------------------- |
| **Revenue** | Total revenue before discounts and returns | `SUM(total_amount)` | Currency (USD, 2 decimal places) |
| **Average Order Value** | Average amount spent per order | `AVG(total_amount)` | Currency (USD, 2 decimal places) |
| **Profit Margin** | Percentage of revenue that is profit | `(SUM(total_amount) - SUM(cost)) / SUM(total_amount) * 100` | Percentage (1 decimal place) |
| **Items Per Order** | Average number of items in each order | `SUM(item_count) / COUNT(DISTINCT order_id)` | Number (1 decimal place) |
| **Days to Ship** | Average time between order and shipment | `AVG(EXTRACT(DAY FROM ship_date - order_date))` | Number (1 decimal place) |
| **AverageSalesPerRep** | Average Sales Per Rep | *(Specific SQL would be defined in the system)* | Automatic |
| **DollarConversionRate** | *(Add description in the system)* | *(Specific SQL would be defined in the system)* | Automatic |
| **Total Revenue** | Total revenue from closed-won opportunities | `SUM(total_amount)` *(example)* | Automatic |
| **Win\_Rate** | Ratio of the sum of amounts for closed won opportunities to the sum of amounts for closed won and closed loss opportunities. | *(Specific SQL would be defined in the system)* | Automatic |
By effectively defining and utilizing metrics within your chosen Domains, you can gain deeper insights into your operations and make data-driven decisions that propel your business forward.
## Next Steps
* [Configure Domains](/improve-wisdom-ai-responses/configure-domains)
* [Curate Knowledge Workflow](/improve-wisdom-ai-responses/curate-knowledge-workflow)
* [Basic Tutorial: Connect and Test](/setting-up-wisdom-ai/basic-tutorial-connect-and-test)
* [Advanced Data Modeling: Creating Knowledge](/setting-up-wisdom-ai/advanced-data-modeling-creating-knowledge)
## Sales Metrics Examples
When you create metrics, you define the SQL expression that dictates how the metric is calculated from your raw data. This allows for precise data analysis. Once defined, they will appear in your Metrics list with their descriptions and display formats.
Here are some practical examples of sales metrics and how they might be configured.
| Metric Name | Description | SQL Expression | Display Format |
| :----------------------- | :--------------------------------------------------------------------------------------------------------------------------- | :---------------------------------------------------------- | :------------------------------- |
| **Revenue** | Total revenue before discounts and returns | `SUM(total_amount)` | Currency (USD, 2 decimal places) |
| **Average Order Value** | Average amount spent per order | `AVG(total_amount)` | Currency (USD, 2 decimal places) |
| **Profit Margin** | Percentage of revenue that is profit | `(SUM(total_amount) - SUM(cost)) / SUM(total_amount) * 100` | Percentage (1 decimal place) |
| **Items Per Order** | Average number of items in each order | `SUM(item_count) / COUNT(DISTINCT order_id)` | Number (1 decimal place) |
| **Days to Ship** | Average time between order and shipment | `AVG(EXTRACT(DAY FROM ship_date - order_date))` | Number (1 decimal place) |
| **AverageSalesPerRep** | Average Sales Per Rep | *(Specific SQL would be defined in the system)* | Automatic |
| **DollarConversionRate** | *(Add description in the system)* | *(Specific SQL would be defined in the system)* | Automatic |
| **Total Revenue** | Total revenue from closed-won opportunities | `SUM(total_amount)` *(example)* | Automatic |
| **Win\_Rate** | Ratio of the sum of amounts for closed won opportunities to the sum of amounts for closed won and closed loss opportunities. | *(Specific SQL would be defined in the system)* | Automatic |
By effectively defining and utilizing metrics within your chosen Domains, you can gain deeper insights into your operations and make data-driven decisions that propel your business forward.
## Next Steps
* [Configure Domains](/improve-wisdom-ai-responses/configure-domains)
* [Curate Knowledge Workflow](/improve-wisdom-ai-responses/curate-knowledge-workflow)
* [Basic Tutorial: Connect and Test](/setting-up-wisdom-ai/basic-tutorial-connect-and-test)
* [Advanced Data Modeling: Creating Knowledge](/setting-up-wisdom-ai/advanced-data-modeling-creating-knowledge)